[Tex/LaTex] Draw 3D Cubes around centre

3dtikz-pgf

I'm trying to draw a set of rotated rectangular cuboids around a centre point in Tikz. I've created an example of what I'm trying to achieve in OpenSCAD below

set of cuboids in a circle

with the code to generate the above figure in OpenSCAD:

 for (i = [0:45:360]) {
    rotate([0,i,0])
    {
        translate([2,0,-0.5]){
            cube([2,0.5,1]);
        }
    }
}

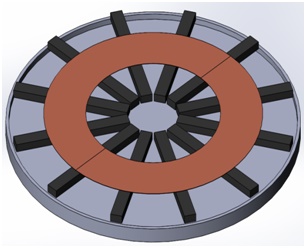
The purpose is to draw the ferrites in an Inductive Power Transfer Magnetic Coupler (pad), an example of the diagram I would like to draw is below

Circular IPT Pad

I think, the other parts are quite achievable, but the rotated blocks are a challenge. I guess because, as many people have noted, TikZ does not have a 3D engine.

I have had a go at making something like what I want here:

\documentclass[border=7pt]{standalone}

\usepackage{tikz}
\usepackage{tikz-3dplot}

%%%%%%%%%%%

\begin{document}

    \tdplotsetmaincoords{-60}{-50}

    \begin{tikzpicture}
    [
        tdplot_main_coords,
    ]

        \def\rounding{0.2pt};
        \foreach \i in {10,50,...,360}
        {
            \begin{scope}[rotate around={\i:(0.4,0,0.0)}]
                \pgfmathsetmacro{\cubex}{1}
                \pgfmathsetmacro{\cubey}{0.1}
                \pgfmathsetmacro{\cubez}{0.1}
                % http://tex.stackexchange.com/questions/12020/what-is-the-easiest-way-to-draw-3d-cube-with-tikz
                \draw[rounded corners = \rounding,fill=black!70] (0,0,0) -- ++(-\cubex,0,0) -- ++(0,-\cubey,0) -- ++(\cubex,0,0) -- cycle;
                \draw[rounded corners = \rounding,fill=black!70] (0,0,0) -- ++(0,0,-\cubez) -- ++(0,-\cubey,0) -- ++(0,0,\cubez) -- cycle;
                \draw[rounded corners = \rounding,fill=black!70] (0,0,0) -- ++(-\cubex,0,0) -- ++(0,0,-\cubez) -- ++(\cubex,0,0) -- cycle;
            \end{scope}
        }

    \end{tikzpicture}

\end{document}

which currently looks like this

Cubes weirdly arranged in a flat circle

I had to set the \tdplotsetmaincoords{-60}{-50} to a negative number, otherwise you see the 'back' of the cuboid.

I don't know, how to make the circle of cuboids lean back into the page, any help would be greatly appreciated. I also don't know, how to rotate the cubes so they look right, at the moment it looks quite odd.

Best Answer

The proper way to rotate things in 3d with tikz-3dplot is to use rotated coordinates, for rotations about the z-axis you can use \tdplotsetrotatedcoords{\i}{00}{0}. Then the cubes which you are using were drawn for specific view angles. In order to make them fully rotatable you need to, depending on the view angles, draw different faces. To this end, I am using a tool that figures out what the projections are: get projections. This allows one to draw (only) the faces that are closest to the observer (and which is why there are the \ifnums that look at the x, y and z projections).

\documentclass[tikz,border=7pt]{standalone}
\usepackage{tikz-3dplot}
\tikzset{get projections/.style={insert path={%
let \p1=(1,0,0),\p2=(0,1,0)  in 
[/utils/exec={\pgfmathtruncatemacro{\xproj}{sign(\x1)}\xdef\xproj{\xproj}
\pgfmathtruncatemacro{\yproj}{sign(\x2)}\xdef\yproj{\yproj}
\pgfmathtruncatemacro{\zproj}{sign(cos(\tdplotmaintheta))}\xdef\zproj{\zproj}}]}},
}
%%%%%%%%%%%

\begin{document}

\tdplotsetmaincoords{-60}{-50}

\begin{tikzpicture}[tdplot_main_coords]
    \pgfmathsetmacro{\cubex}{1}
    \pgfmathsetmacro{\cubey}{0.1}
    \pgfmathsetmacro{\cubez}{0.1}
    \pgfmathsetmacro{\cubedist}{0.4}
    \def\rounding{0.2pt};
    \foreach \i in {10,50,...,360}
    { \tdplotsetrotatedcoords{\i}{00}{0}
        \begin{scope}[tdplot_rotated_coords]
            \path[get projections];
            %\draw (-\cubedist,0,0) -- (-2,0,0)  node{\xproj,\yproj,\zproj};
            % http://tex.stackexchange.com/questions/12020/what-is-the-easiest-way-to-draw-3d-cube-with-tikz
            \ifnum\yproj=1
             \draw[rounded corners = \rounding,fill=black!70] (-\cubedist,0,0) -- ++(0,0,-\cubez) -- ++(0,-\cubey,0) -- ++(0,0,\cubez) -- cycle;
            \else
             \draw[rounded corners = \rounding,fill=black!70] (-\cubedist-\cubex,0,0) -- ++(0,0,-\cubez) -- ++(0,-\cubey,0) -- ++(0,0,\cubez) -- cycle;
            \fi
            \ifnum\xproj=1             
             \draw[rounded corners = \rounding,fill=black!70] (-\cubedist,-\cubey,0) -- ++(-\cubex,0,0) -- ++(0,0,-\cubez) -- ++(\cubex,0,0) -- cycle;
            \else
             \draw[rounded corners = \rounding,fill=black!70] (-\cubedist,0,0) -- ++(-\cubex,0,0) -- ++(0,0,-\cubez) -- ++(\cubex,0,0) -- cycle;
            \fi
            \draw[rounded corners = \rounding,fill=black!70] (-\cubedist,0,-\cubez) -- ++(-\cubex,0,0) -- ++(0,-\cubey,0) -- ++(\cubex,0,0) -- cycle;
        \end{scope}
    }

\end{tikzpicture}

\end{document}

enter image description here

I personally would prefer to dial a positive theta and positive lengths, then the completion of the figure is arguably much more straightforward. Then, in order to come closer to the OpenSCAD syntax, I stored the definition of the cuboid in a style (this is certainly not the first post defining a cuboid pic), in which there is an attempt of automatic shading, less sophisticated than what pstricks has to offer and certainly much less less convincing than asymptote. This pic can be used as

 \path (<coordinate>) pic{cuboid={x=<x>,y=<y>,z=<z>}};

and certainly can be made more flexible, if needed (but this flexibility comes with a slightly longer code). Note also that if you want the cuboids to go closer to each other, some care has to be taken in which order they are drawn: you need to draw those which are in be back first.

\documentclass[tikz,border=7pt]{standalone}
\usepackage{tikz-3dplot}
\tikzset{get projections/.style={insert path={%
let \p1=(1,0,0),\p2=(0,1,0)  in 
[/utils/exec={\pgfmathtruncatemacro{\xproj}{sign(\x1)}\xdef\xproj{\xproj}
\pgfmathtruncatemacro{\yproj}{sign(\x2)}\xdef\yproj{\yproj}
\pgfmathtruncatemacro{\zproj}{sign(cos(\tdplotmaintheta))}\xdef\zproj{\zproj}}]}},
pics/cuboid/.style={code={\tikzset{cuboid/.cd,#1}
 \path[get projections];
 \ifnum\yproj=-1
  \draw let \p1=(1,0,0),\n1={atan2(\y1,\x1)} 
  in [/utils/exec=\pgfmathsetmacro{\mybr}{70-20*sin(\n1)}]
  [rounded corners = \rounding,fill=black!\mybr] 
     (0,-\cubey/2,0) -- ++(0,0,\cubez) -- ++(0,\cubey,0) -- ++(0,0,-\cubez) -- cycle;
 \else
  \draw let \p1=(1,0,0),\n1={atan2(\y1,\x1)} 
  in [/utils/exec=\pgfmathsetmacro{\mybr}{70+20*sin(\n1)}]
  [rounded corners = \rounding,fill=black!\mybr] 
     (0+\cubex,-\cubey/2,0) -- ++(0,0,\cubez) -- ++(0,\cubey,0) -- ++(0,0,-\cubez) -- cycle;
 \fi
 \ifnum\xproj=-1             
  \draw let \p1=(0,1,0),\n1={atan2(\y1,\x1)} 
  in [/utils/exec=\pgfmathsetmacro{\mybr}{70+20*sin(\n1)}]
  [rounded corners = \rounding,fill=black!\mybr] 
     (0,\cubey/2,0) -- ++(\cubex,0,0) -- ++(0,0,\cubez) -- ++(-\cubex,0,0) -- cycle;
 \else
  \draw let \p1=(0,1,0),\n1={atan2(\y1,\x1)} 
  in [/utils/exec=\pgfmathsetmacro{\mybr}{70-20*sin(\n1)}]
  [rounded corners = \rounding,fill=black!\mybr] 
     (0,-\cubey/2,0) -- ++(\cubex,0,0) -- ++(0,0,\cubez) -- ++(-\cubex,0,0) -- cycle;
 \fi
  \draw let \p1=(0,0,1),\n1={atan2(\y1,\x1)} 
  in [/utils/exec=\pgfmathsetmacro{\mybr}{70-20*sin(\n1)}]
   [rounded corners = \rounding,fill=black!\mybr]
     (0,-\cubey/2,\cubez) -- ++(\cubex,0,0) -- ++(0,\cubey,0) --
     ++(-\cubex,0,0) -- cycle;}},
 cuboid/.cd,x/.estore in=\cubex,y/.estore in=\cubey,z/.estore
 in=\cubez,rounding/.estore in=\rounding,rounding=0.2pt  
}
%%%%%%%%%%%
\definecolor{bred}{RGB}{151,73,59}
\begin{document}

\tdplotsetmaincoords{60}{-50}

\begin{tikzpicture}[tdplot_main_coords,cuboid/.cd,x=4,y=0.4,z=0.4]
    \pgfmathsetmacro{\cubedist}{0.8}
    \fill[gray!40] plot[smooth,variable=\t,domain=0:360,samples=51] 
        ({(\cubex+\cubedist)*cos(\t)},
        {(\cubex+\cubedist)*sin(\t)},-\cubez);
    \draw[ultra thin,left color=gray!60,right color=gray!80,middle color=gray!20] 
        plot[smooth,variable=\t,domain=\tdplotmainphi:\tdplotmainphi+180] 
        ({(\cubex+\cubedist)*cos(\t)},
        {(\cubex+\cubedist)*sin(\t)},0)
        -- 
        plot[smooth,variable=\t,domain=\tdplotmainphi+180:\tdplotmainphi] 
        ({(\cubex+\cubedist)*cos(\t)},
        {(\cubex+\cubedist)*sin(\t)},-\cubez) -- cycle;
    \draw[ultra thin,left color=gray!80,right color=gray!60,middle color=gray!20] 
        plot[smooth,variable=\t,domain=\tdplotmainphi:\tdplotmainphi-180] 
        ({(\cubex+\cubedist)*cos(\t)},
        {(\cubex+\cubedist)*sin(\t)},0)
        -- 
        plot[smooth,variable=\t,domain=\tdplotmainphi-180:\tdplotmainphi] 
        ({(\cubex+\cubedist)*cos(\t)},
        {(\cubex+\cubedist)*sin(\t)},-\cubez) -- cycle;
    \draw[ultra thin,fill=gray!10,even odd rule] plot[smooth,variable=\t,domain=0:360,samples=51] 
        ({(\cubex+\cubedist)*cos(\t)},
        {(\cubex+\cubedist)*sin(\t)},0)
        plot[smooth,variable=\t,domain=0:360,samples=51] 
        ({0.98*(\cubex+\cubedist)*cos(\t)},
        {0.98*(\cubex+\cubedist)*sin(\t)},0);   
    \foreach \i in {50,90,130,170,10,-30,-70,...,-150} %<-note that this list depends on phi
    { \tdplotsetrotatedcoords{\i}{00}{0}
        \begin{scope}[tdplot_rotated_coords]
          \path (\cubedist,0,0) pic{cuboid};  
        \end{scope}
    }
    \begin{scope}[canvas is xy plane at z=\cubez]
        \fill[bred,even odd rule] circle[radius=\cubex]
        circle[radius=0.6*\cubex];
        \draw[ultra thin] (0:0.6*\cubex) -- (0:\cubex)  (180:0.6*\cubex) -- (180:\cubex);
    \end{scope}
\end{tikzpicture}
\end{document}

enter image description here

As usual, the view can be rotated, and the appropriate ordering of the cuboids can be automatized.

\documentclass[tikz,border=7pt]{standalone}
\usepackage{tikz-3dplot}
\tikzset{get projections/.style={insert path={%
let \p1=(1,0,0),\p2=(0,1,0)  in 
[/utils/exec={\pgfmathtruncatemacro{\xproj}{sign(\x1)}\xdef\xproj{\xproj}
\pgfmathtruncatemacro{\yproj}{sign(\x2)}\xdef\yproj{\yproj}
\pgfmathtruncatemacro{\zproj}{sign(cos(\tdplotmaintheta))}\xdef\zproj{\zproj}}]}},
pics/cuboid/.style={code={\tikzset{cuboid/.cd,#1}
 \path[get projections];
 \ifnum\yproj=-1
  \draw let \p1=(1,0,0),\n1={atan2(\y1,\x1)} 
  in [/utils/exec=\pgfmathsetmacro{\mybr}{70-20*sin(\n1)}]
  [rounded corners = \rounding,fill=black!\mybr] 
     (0,-\cubey/2,0) -- ++(0,0,\cubez) -- ++(0,\cubey,0) -- ++(0,0,-\cubez) -- cycle;
 \else
  \draw let \p1=(1,0,0),\n1={atan2(\y1,\x1)} 
  in [/utils/exec=\pgfmathsetmacro{\mybr}{70+20*sin(\n1)}]
  [rounded corners = \rounding,fill=black!\mybr] 
     (0+\cubex,-\cubey/2,0) -- ++(0,0,\cubez) -- ++(0,\cubey,0) -- ++(0,0,-\cubez) -- cycle;
 \fi
 \ifnum\xproj=-1             
  \draw let \p1=(0,1,0),\n1={atan2(\y1,\x1)} 
  in [/utils/exec=\pgfmathsetmacro{\mybr}{70+20*sin(\n1)}]
  [rounded corners = \rounding,fill=black!\mybr] 
     (0,\cubey/2,0) -- ++(\cubex,0,0) -- ++(0,0,\cubez) -- ++(-\cubex,0,0) -- cycle;
 \else
  \draw let \p1=(0,1,0),\n1={atan2(\y1,\x1)} 
  in [/utils/exec=\pgfmathsetmacro{\mybr}{70-20*sin(\n1)}]
  [rounded corners = \rounding,fill=black!\mybr] 
     (0,-\cubey/2,0) -- ++(\cubex,0,0) -- ++(0,0,\cubez) -- ++(-\cubex,0,0) -- cycle;
 \fi
  \draw let \p1=(0,0,1),\n1={atan2(\y1,\x1)} 
  in [/utils/exec=\pgfmathsetmacro{\mybr}{70-20*sin(\n1)}]
   [rounded corners = \rounding,fill=black!\mybr]
     (0,-\cubey/2,\cubez) -- ++(\cubex,0,0) -- ++(0,\cubey,0) --
     ++(-\cubex,0,0) -- cycle;}},
 cuboid/.cd,x/.estore in=\cubex,y/.estore in=\cubey,z/.estore
 in=\cubez,rounding/.estore in=\rounding,rounding=0.2pt  
}
%%%%%%%%%%%
\definecolor{bred}{RGB}{151,73,59}
\begin{document}
\pgfmathsetmacro{\xmin}{0}
\pgfmathsetmacro{\xmax}{0}
\pgfmathsetmacro{\ymin}{0}
\pgfmathsetmacro{\ymax}{0}
\foreach \X in {5,15,...,355}
{\tdplotsetmaincoords{60}{\X}
\begin{tikzpicture}[tdplot_main_coords,cuboid/.cd,x=4,y=0.4,z=0.4]
    \ifdefined\figbb\relax
    \path[tdplot_screen_coords] \figbb;
    \fi    
    \pgfmathsetmacro{\cubedist}{0.8}
    \fill[gray!40] plot[smooth,variable=\t,domain=0:360,samples=51] 
        ({(\cubex+\cubedist)*cos(\t)},
        {(\cubex+\cubedist)*sin(\t)},-\cubez);
    \draw[ultra thin,left color=gray!60,right color=gray!80,middle color=gray!20] 
        plot[smooth,variable=\t,domain=\tdplotmainphi:\tdplotmainphi+180] 
        ({(\cubex+\cubedist)*cos(\t)},
        {(\cubex+\cubedist)*sin(\t)},0)
        -- 
        plot[smooth,variable=\t,domain=\tdplotmainphi+180:\tdplotmainphi] 
        ({(\cubex+\cubedist)*cos(\t)},
        {(\cubex+\cubedist)*sin(\t)},-\cubez) -- cycle;
    \draw[ultra thin,left color=gray!80,right color=gray!60,middle color=gray!20] 
        plot[smooth,variable=\t,domain=\tdplotmainphi:\tdplotmainphi-180] 
        ({(\cubex+\cubedist)*cos(\t)},
        {(\cubex+\cubedist)*sin(\t)},0)
        -- 
        plot[smooth,variable=\t,domain=\tdplotmainphi-180:\tdplotmainphi] 
        ({(\cubex+\cubedist)*cos(\t)},
        {(\cubex+\cubedist)*sin(\t)},-\cubez) -- cycle;
    \draw[ultra thin,fill=gray!10,even odd rule] plot[smooth,variable=\t,domain=0:360,samples=51] 
        ({(\cubex+\cubedist)*cos(\t)},
        {(\cubex+\cubedist)*sin(\t)},0)
        plot[smooth,variable=\t,domain=0:360,samples=51] 
        ({0.98*(\cubex+\cubedist)*cos(\t)},
        {0.98*(\cubex+\cubedist)*sin(\t)},0);
    \pgfmathtruncatemacro{\tmpA}{10+\tdplotmainphi+90-mod(360+\tdplotmainphi+90,40)}        
    \pgfmathtruncatemacro{\tmpB}{\tmpA+40}      
    \pgfmathtruncatemacro{\tmpC}{\tmpA+160}     
    \pgfmathtruncatemacro{\tmpD}{\tmpA-40}      
    \pgfmathtruncatemacro{\tmpE}{\tmpA-80}      
    \pgfmathtruncatemacro{\tmpF}{\tmpA-160}     
    \foreach \i in {\tmpA,\tmpB,...,\tmpC,\tmpD,\tmpE,...,\tmpF} %<-automatized
    { \tdplotsetrotatedcoords{\i}{00}{0}
        \begin{scope}[tdplot_rotated_coords]
          \path (\cubedist,0,0) pic{cuboid};  
        \end{scope}
    }
    \begin{scope}[canvas is xy plane at z=\cubez]
        \fill[bred,even odd rule] circle[radius=\cubex]
        circle[radius=0.6*\cubex];
        \draw[ultra thin] (0:0.6*\cubex) -- (0:\cubex)  (180:0.6*\cubex) -- (180:\cubex);
    \end{scope}
    \path let \p1=(current bounding box.south west),
    \p2=(current bounding box.north east)
    in \pgfextra{%
    \pgfmathsetmacro{\xmin}{min(\x1,\xmin)}
    \pgfmathsetmacro{\xmax}{max(\x2,\xmax)}
    \pgfmathsetmacro{\ymin}{min(\y1,\ymin)}
    \pgfmathsetmacro{\ymax}{max(\y2,\ymax)}
    \xdef\xmin{\xmin pt}
    \xdef\xmax{\xmax pt}    
    \xdef\ymin{\ymin pt}
    \xdef\ymax{\ymax pt}    
    };  
\end{tikzpicture}}
\makeatletter               
\edef\figbb{(\xmin,\ymin) rectangle (\xmax,\ymax)}
\immediate\write\@mainaux{\xdef\string\figbb{\figbb}\relax}
\makeatother
\end{document}

enter image description here