Everything is all right before I updated all my MiKTeX package to latest version. But after that, I find that all .eps file generated by Matlab cannot be shown correctly.
For example. I use Matlab to plot sin(n)
n = 1:0.1:50;
plot(n, sin(n));
And I got the figure like this.

I use Matlab 2013a(tested in 2011b as well).
I save this figure by File-> Save As...-> test.eps.
But when I use LaTeX to generate .pdf file with this piece of code
\documentclass[a4paper]{article}
\usepackage{graphicx}
\begin{document}
test1
\begin{figure}
 \begin{center}
  \includegraphics[height=140mm]{test.eps}
 \end{center}
\end{figure}
test2
\end{document}
I use xelatex to compile my .tex file, and got a pdf like this
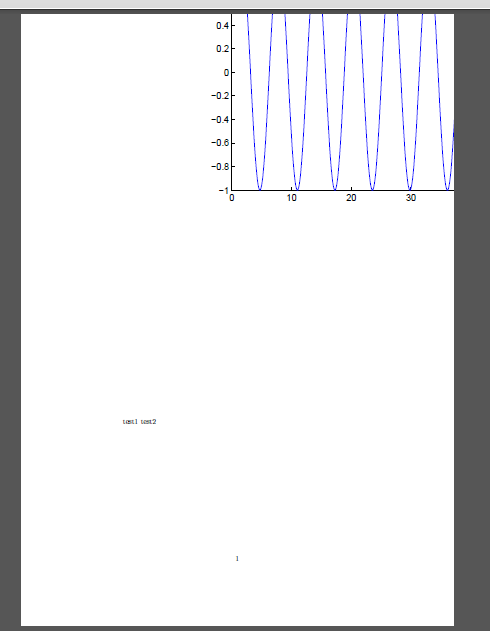
The .eps file is shown at wrong position. "center" seems to be useless. I have done other tests, which prove that .eps file generated by other software(Word, Adobe Acrobat) can be shown correctly. Therefore, I think the problem may lie in Matlab. Perhaps the .eps file generated by Matlab is not compatible with some tex package.
This subtle problem has wasted me much time. Does anybody know why and how to solve the problem ?
Thanks!

Best Answer
I will just try to give you a quick push. If I recall correctly
\begin{center}puts the center of the coordinate system which is left lower corner of your picture (think of picture being in the first quadrant) at the center of the page. That is exactly what I see on your figure. Did you play with moving things left down etc? I do not have now to check right now but I would be very, very surprised to see that MATLAB doesn't produce correctepsfile (that it does not compute correct Bounding Boxes). You can always export figure as PostScript and then use something ps2eps to produce correct Bounding Boxes for thoseepsfiles and filters some special postscript command sequences that can produce erroneous results.