Recently, while looking at the Van der Waals gas and its implications for phase transitions I stumbled across a problem.
We derived the normal Van der Waals gas equation: $$ \left(p+\frac{aN^2}{V^2}\right)\left(V-bN\right)=Nk_BT$$
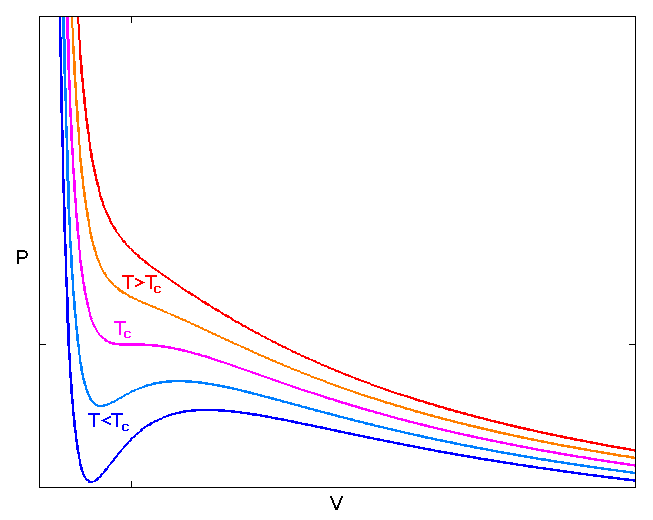
We plotted the isotherms for such a gas, which looked like this:
 !
!
Our lecturer then explained that due to the unphysical behaviour of the gas having a negative compressibility $\frac{\partial p}{\partial V} \le 0$ for a certain range of Volumes when the temperature is below $T_c$, we have to look at the Helmholtz free energy to determine what exactly is going on.
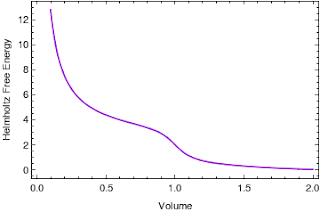
Using the fact that $\left(\frac{\partial F}{\partial V}\right)_{T,N} = -p$ he explained that the $F-V$ graph should look like this:
 !
!
(The graph our lecturer showed actually had a local minimum and local maximum)
The following part is the one I do not quite understand:
He then explained that regions where F(V) is concave, i.e. $\left(\frac{\partial^2 F}{\partial V^2}\right)_{T,N} < 0 $ are unphysical and do not represent a system in equilibrium.
Now my question is: As far as I understand it a system at fixed T and V, as is the case here, tries to minimise its Helmholtz free energy F. Such that when the system is in equilibrium F is a minimum. How does this lead to the condition stated by our lecturer, which is a region where F(V) is concave cannot represent an equilibrium?

Best Answer
Because the Helmholtz free energy graph (at a fixed temperature) is not convex, we can draw the following tangent line. It touches the graph at two points A and B, with corresponding volumes $V_A$ and $V_B$, and free energies $F_A$ and $F_B$. These two points are special, for reasons we'll get to in a moment.
Suppose our system has a volume that's exactly halfway between $V_A$ and $V_B$. Let's consider two possible states the system could be in:
A homogeneous state, with a constant density throughout the system. This density is determined by the van der Waals equation of state, and so its Helmholtz free energy lies on the purple curve (which is constructed from the equation of state directly.)
A heterogeneous state, where the system has divided itself into two parts: half of the volume is in state $A$, while half of the volume is in state $B$. The total volume of the system is halfway between $V_A$ and $V_B$; and the total Helmholtz free energy of the system is also halfway between $F_A$ and $F_B$. In other words, the total Helmholtz free energy of the system lies along the red tangent line, halfway between $A$ and $B$.
But for a fixed temperature and volume, the Helmholtz free energy is minimized in equilibrium. This means that the heterogeneous state must be the equilibrium state, since its $F$ is lower. A similar logic can be applied to any volume between $V_A$ and $V_B$; for example, if the volume of our system is 10% of the way from $V_A$ to $V_B$, then the equilibrium state will be a heterogenous state where 10% of the volume is in state A and 90% is in state B.
In other words, for any volume between $V_A$ and $V_B$, the system "wants" to separate itself into two parts of different densities, since that will give it a lower Helmholtz free energy. If we imagine compressing this system at fixed $T$ from a large initial volume, it would initially be in a less-dense state, with a $V$ and $F$ somewhere along the purple curve to the right. When we compress it down to $V_B$, we would start to see the system separate into two parts: one with the same density the system had at $V_B$, and another more dense part with higher density. This denser part of the system would grow until the volume decreased to $V_A$; during this transition, the system's total $V$ and $F$ lie somewhere along the red curve. Finally, when we reached $V_A$, the system would be entirely in the denser phase, and further compression would cause $V$ and $F$ to follow the purple curve on the left.
If you're paying close attention, you might notice that I've implicitly assumed that these two "subsystems" in states A and B are in equilibrium with each other. But is this actually the case? Thankfully, yes. The two subsystems can exchange energy, volume, and particles; so to be in equilibrium, they must have the same temperature, pressure, and chemical potential. We're working at a fixed temperature by assumption, so that's not a problem. The pressures are the same too, since $$ P = - \left( \frac{\partial F}{\partial V} \right)_{T,N}. $$ By construction, the slope of the Helmholtz free energy is the same at points $A$ and $B$; thus, $P_A = P_B \equiv P$. Finally, we note that since these two points are connected by a straight line, we have $$ \frac{F_B - F_A}{V_B - V_A} = - P, $$ which can be rearranged to obtain $F_B + P V_B = F_A + P V_A$, or $G_A = G_B$, which implies $\mu_A = \mu_B$. So the two subsystems in the heterogeneous state are indeed in equilibrium.
As an aside: note that the condition $\left(\frac{\partial^2 F}{\partial V^2}\right)_{T,N} < 0$ is not satisfied by all the points between $A$ and $B$. If the Helmholtz free energy graph is concave down, this means that the system is unstable; but the converse is not necessarily true, since there are points along the graph for which $\left(\frac{\partial^2 F}{\partial V^2}\right)_{T,N} > 0$ but which do not represent states of minimal $F$ when compared to a heterogeneous state.