I know that there are similar questions already answered here on Physics StackExchange but the following things are still unclear to me:
-
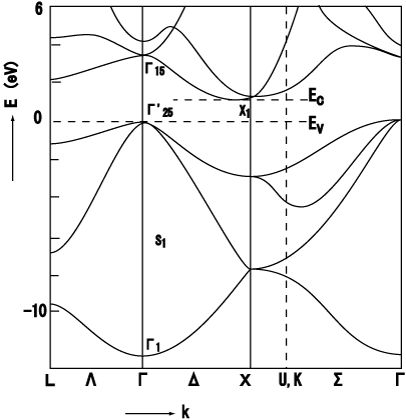
Is it correct that an electron inside a crystal with a band structure shown above can have any energy inside the band? What is this energy (neglecting such things as external magnetic fields etc.)?
-
How do I have to read these types of plots, i.e. where are the gaps? Or stated differently: How can I know from the picture which are the filled bands and which are the gaps? Is the region below the first line with an energy between -7 and -14 eV a band or a gap?
-
How comes that there are bands but if I consider only one atom this has a parabolic energy dispersion with only one allowed energy for every k-vector. I have seen the calculation for two atoms and how there appears a gap. But there the electrons still can have only two energies per k-vector and I can't really make the jump to the continous bands. Is this under the (justified) assumption that there are infinitely many atoms? Unfortunately, every textbook makes this jump directly without ever explaining it rigorously, i.e. with a calculation (altough it kind of makes sense).

Best Answer
Yes, this plot is a little tricky to gain intuition on right away. I am still working on it myself. Here's what I understand about this.
1) Each line is an eigenmode, which for that particular material is the allowable fundamental modes for given wavenumbers
2) The x axis corresponds to the physical space of the unit cell. This labeling depends on the how you setup your fundamental unit. In periodic structures, you are able to describe most of the physics by simplifying it's features to the smallest unit that describes most of the properties.
3) The y axis gives you the amount of energy
Let's walk through an example :
1) Start at one tick on the x axis (gamma for starters) and go up along the y-axis.
2) Once you run into a line that means you ran into the first eigenmode
3) If you continue up then you run into the second line, which is the second eigenmode
4) Each jump between lines you need to make is a gap
5) For the lower energy states (like the one in these pictures) there are big distinctions between each allowable energy state. When you get up to higher energies than there are not very large gaps between eigenmodes, which makes it more into a continuum of allowable energies.
6) Things get 'upgraded' to a bandgap when these gaps extend across a broad range of x values.
Hope that helps!