A typical velocity-time graph for a bouncing ball is shown below. I understand that the ball starts from rest at $t=0$, then it accelerates downwards and hits the floor at time $t_1$. Between time $t_1$ and $t_2$, the ball experiences an upward reaction from the floor and its velocity changes. At time $t_2$, the ball leaves the floor and bounces back.
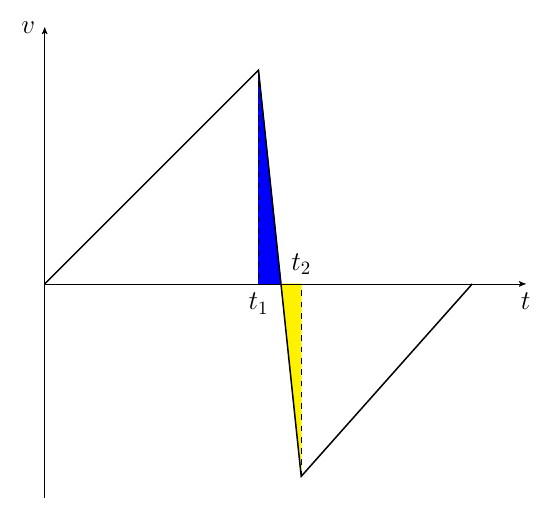
Here is what confuses me. As the area bounded by the velocity-time graph can be interpreted as the distance traveled. I don't really understand what is the interpretation of the blue and yellow piece shaded in the graph below. For a ball hitting the floor at a speed of about 10 metres per second, with time of impact of about 0.1 seconds, the calculation shows this distance could be as large as 0.5 metre, way larger than the size of a tennis ball. If the time of impact is even larger, this distance would increases in proportion as well. But obviously during this time, the ball does not go anywhere but hits hard with the floor.
I guess the solution lies in the fact that the ball cannot be treated as a point mass anymore during the time of impact, as the velocities at different positions inside the ball would be all different. But I still have no idea about what these two coloured area represent. Is the distance interpretation wrong? Or should this graph be understood in a different way?
Best Answer
No, all your reasoning is totally right. The conclusion isn't that the graphs are wrong, it's that the time of impact is less than 0.1 second. In this video, for example, the time of impact is just about 0.01 seconds.