MATLAB: Max – Median – Min – Phoney Box Plot

boxplotcategoricalgraphsMATLAB

I have some data in which I need to plot the min, max and median in a similar fashion to a box plot.
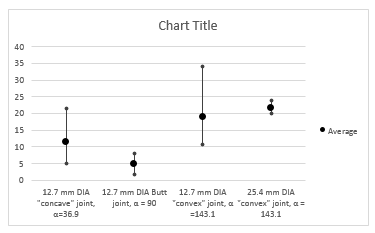
The x axis would have my variables and the y axis would have values with a marker for mean, min and max.
Something like the below would be brill. (Sorry for poor image quality!)
I don't really want to create a
AvgMaxMinBasicChart.png

Best Answer

I resolved this by using the errorplot function with the below code.
In this case used 7 data sets, though this could be adjusted for more or less and probably made a little more efficient.
I have used 3 std deviations rather than min / max as it was more appropriate for my application. The error bars are equal on either side.
%sData Row 1 = mean
%sData Row 2 = 3.std deviations
errorbar(1:1:7,sData(1,1:1:7),sData(2,1:1:7),'LineStyle','none','Marker','x')
xlim([0 8])
xticklabels({'' 'Data1' 'Data2' 'Data3' 'Data4' 'Data5' 'Data6' 'Data7' })
xlabel('X Label')
ylabel('Y Label')
title('Example Plot')
ax = gca;
ax.YGrid = 'on'
ax.YMinorGrid = 'on'
Example Plot.png