I'm using audioplayer to generate sound from a series of sine waves (~200 – 500 Hz). My sample rate is 2KHz and each wave is played for 500ms. I'm presenting 16 waves, in series. However, the playback is riddled with audible clicks. These are not at the transition points between each consecutive wave. If I play the wave series (x) directly using 'sound(x, 2000)', I get no clicks. If I write the sounds to a .wav file, I get no clicks and the waveform looks clean in a sound file editor. The clicks are independent of output device also.
MATLAB: Audioplayer function: clicks during playback of sine waves
audioplayer
Related Solutions
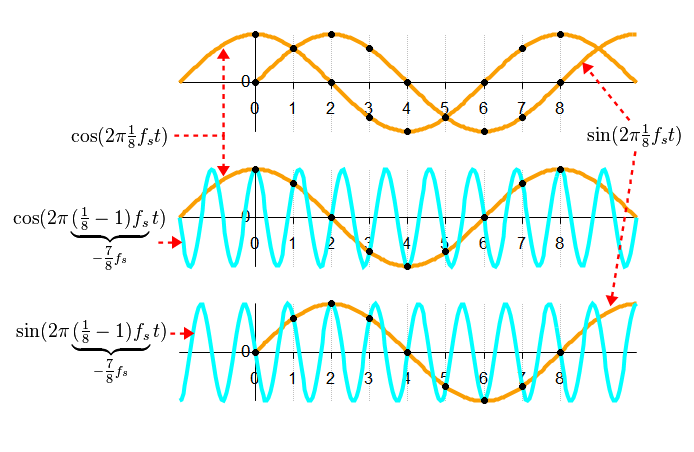
It's called aliasing. Sampling at rate lower than the Nyquist frequency will give signals that look like they are oscillating at a lower frequency. See the Wikipedia article on it: Wikpedia on Aliasing
The attached model contains a sine wave source block, a zero-order hold block, and a spectrum scope block. The frequency of the sine wave is 100 Hz, and its sampling time is 1000 Hz. The sampling time of the zero-order hold block is 75 Hz. When you run the model, you will see a spike in the spectrum scope block at 25 Hz, representing a sinusoid with a frequency of 25 Hz. This is because the 100 Hz source sinusoid becomes aliased to a 25 Hz sinusoid.
In general, f_image = f - N*fs, where f_image is the created, aliased frequency, f is the frequency of the original sinusoid, fs is the new sampling frequency, and N is an integer chosen such that f_image lies within [0, fs/2).
Best Answer