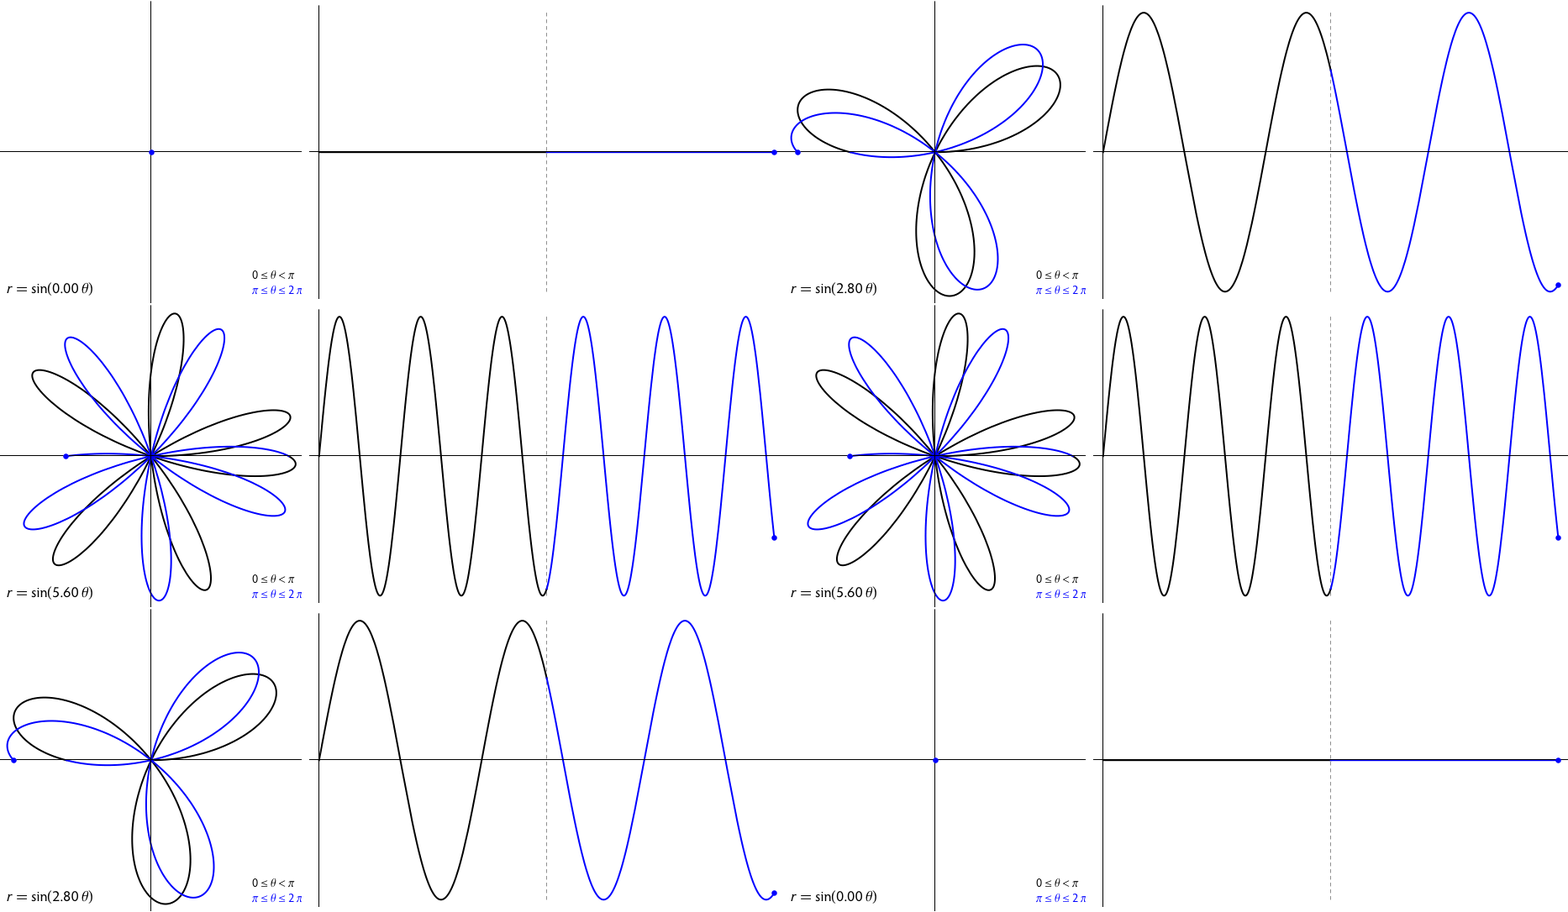
I'm learning about polar coordinates. What is the best way to understand $r=4\cos(6\theta)$ without a computer?
I already knew what the graph of $r=\cos(2\theta)$ looks like. Is there a way to get an idea about $r=4\cos(6\theta)$ using this "parent graph"?
What about the graph of $r=4\cos(5\theta)$. Does the fact that $5$ is odd while $6$ is even make a big difference as to the number of "leaves" that appear on the "rose"? Thanks

Best Answer
We have that $r=\cos ( \theta)$ makes a loop for any interval $\left[-\frac \pi 2 +k\pi ,\frac \pi 2 +k\pi\right]$ but since it leads to negative values for $k$ odd we have that only the loops with $k$ even can be plotted, which is a circle in this case (note that the same plot is obtained if we allow negative values for $r$ since in this case the plots coincide).
Therefore $r=\cos ( 2\theta)$ makes a loop for any interval $\left[-\frac \pi 4 +k\frac \pi 2 ,\frac \pi 4 +k\frac \pi 2\right]$ which correspond to $2$ loops if we restrict to positive values for $r$ and to $4$ loops if we allow negative values also.
So also for $\cos ( 6\theta)$ we have a loop for any interval $\left[-\frac \pi {12} +k\frac \pi 6 ,\frac \pi {12} +k\frac \pi 6\right]$ which correspond to $6$ loops if we restrict to positive values for $r$ and to $12$ loops if we allow negative values also.
For $r=\cos ( 5\theta)$ we have a loop for any interval $\left[-\frac \pi {10} +k\frac \pi {5} ,\frac \pi {10} +k\frac \pi {5}\right]$ which correspond in any case to $5$ loops since the loops for $k$ even ($r>0$) are the same we obtain for $k$ odd ($r<0$).