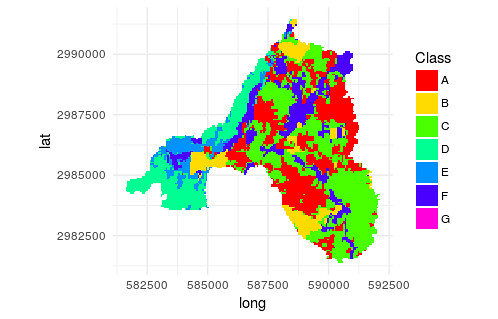
I am trying to plot this raster on R. The object is quite big, but when plotting it using the raster::plot() function, I obtain a very tiny image, as attached.
The code I use to produce it is the following:
r <- raster::raster("MOD13Q1_2000-02-18.250m_16_days_NDVI.tif")
r <- setMinMax(r)
raster::plot(r)
I tried to set xlim limits, with no success. I then tried to move to ggplot2, as an alternative (following here), but I obtain the following
ggplot(r) + geom_tile(aes(fill=value))
Error: ggplot2 doesn't know how to deal with data of class RasterLayer
I found around that, to plot raster objects with ggplot(), I should first convert it into a data.frame. However, as my object is quite big (about 55million obs.), that would be very inefficient. I am then stuck on what to do. Any thoughts?


Best Answer
The base plot method works fine for me:
so I suspect something has gone amiss with your graphics device. If using
rstudio, I think there's a little button to reset the graphics window, otherwise trydev.off()to switch the graphics window off, and the nextplotwill create a new one.This behaviour generally happens when a previous graphics operation has left the graphics device in a non-default state, such as having divided it up to put a legend in a section of window. A reset as described above usually helps.
There's no need to look to
ggplot- therasterpackage plot methods are very well optimised for big rasters and will sample down large rasters for speed.