I would like to use R and leaflet to draw a circle (a real circle on the surface of the earth) on a mercator projection.
In the following code, I have the center of the circle (with lng=0 and lat=60), and I would like to have a parametric equation to draw the circle. I started with the equation below, and I can draw it on a leaflet map:
centre=c(0,60)
t=seq(0,2*pi,0.005)
r=9
xx=cos(t)*r+centre[1]
yy=sin(t)*r+centre[2]
Then I can draw the form on a leaflet map:
leaflet() %>%
  addTiles() %>%
  addPolygons(
    lng=xx, lat=yy,fillColor = "transparent"
  )%>%
  addCircleMarkers(lng=centre[1], lat=centre[2],radius=1,color="red")
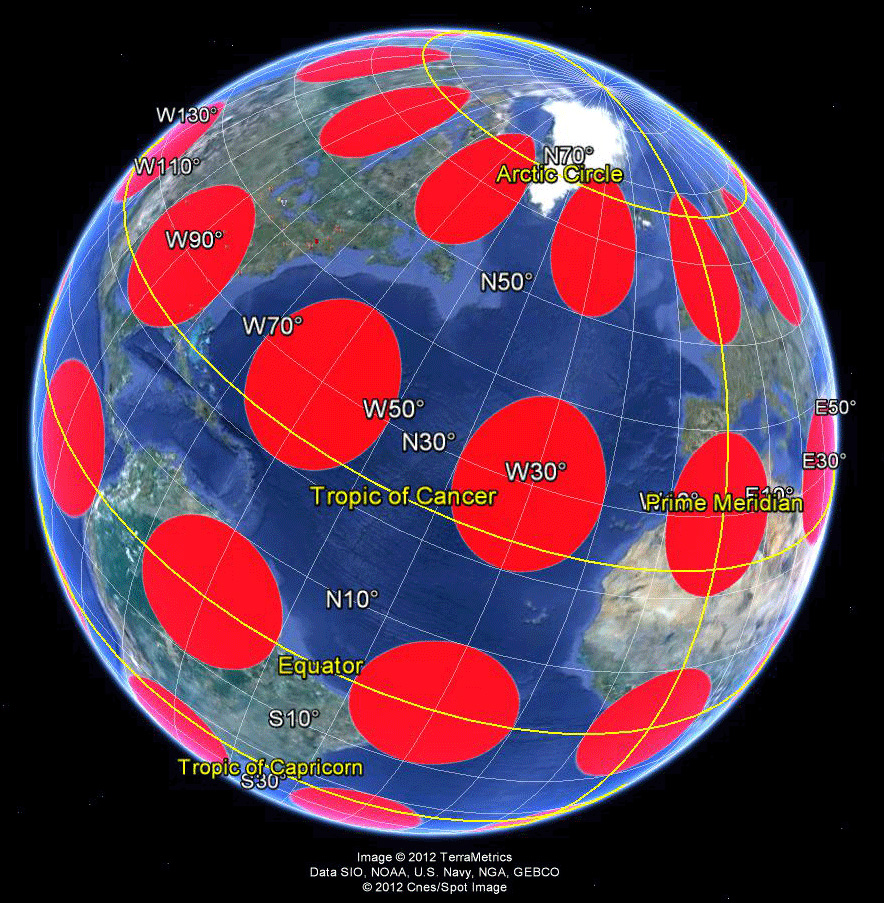
The code above gives this kind of formes on the earth:
http://www.mylovedone.com/image/solstice/sum12/tissotFig3b.jpg
I did't make the image, but I think they are the same. And what I want to draw is this: http://imgur.com/wLptl
How should I modify the equation of the circle so that I can obtain a real circle.
Is this a Tissot's indicatrix? It seems that a Tissot's indicatrix is to render a circle on the sphere on a map. However, the Tissot's indicatrix on a mercator projection is a circle! I can't understand how it is possible. Since if you draw a circle on the north pole, there is no way it is a circle on mercator projection.
EDIT: I found this web site http://www.movable-type.co.uk/scripts/latlong.html it shows the equation of destinations, givens one point, the direction and the distance. So it is then possible to draw the cercle!
Best Answer
One way is to draw in Orthographic and reproject. It's not very generalizable though, and I'm unsure how accurate this is at 1000skm scales. (Looks good for this example compared to Manifold's geog-circle).
```
Otherwise you could use
geosphere::destPointto project out to a certain distance from a centre and get lon/lats for the circle, then transform those to Mercator.